HIDE / SEEK
12 Apostles, Victoria
The Twelve Apostles is a collection of limestone stacks off the shore of the Port Campbell National Park, by the Great Ocean Road in Victoria, Australia. One of the most popular tourist attraction in Victoria.
Over tourism has been an ongoing issue for this site for many years. This research is looking into a way to inform the tourist in the environmental aspects of this site. Hoping the tourist can learn and respect the value of the land when they arrive at 12 Apostles. Through a storytelling journey from the moment they arrive in Melbourne to their destination 12 Apostles.

12 Apostles


This research is laid out as a journey of discovery down to 12 Apostles. It's focusing on the tourist coming in a group. The drive from Southern Cross Station to 12 Apostles is roughly a 3 hours drive down the coastline. During this time, I have created a serious exploration for them to discover along the road.
I believe the time spent traveling can be transformative.
This research proudly acknowledges the Eastern Maar and Wadawurrung People as the traditional custodians of the Great Ocean Road region. We pay our respects to their Ancestors and Elders, past and present.

This is a collage representing the erosion of the limestone stack at 12 Apostles, with overcrowded tourists not obeying the signage and standing at the edge of the cliff.
Experimentation

In this experimentation, I was trying to create an activity that the tourist can interact during the drive. This word search includes words that represent problems that occur at 12 Apostles.

The wave inside the collage represents the data graph from the sea level. This collage depicts the idea of rising sea level and erosion of the limestone stack.
Melbourne Airport is where most mass tourists come through as they enter Victoria. This research is targeting tourists coming in groups.
This QR code will be displayed on the advertising screen along with the 12 apostles ad to scan, the code will also be advertised through each tourist bus group going down to great ocean road.


01
Melbourne Airport
Southern Cross Station

Once the group gather at the station, the tour guide will hand everyone a postcard as a souvenir to bring along the journey.
The front of the postcard was a collage image with converting climate data at 12 apostles. Trying to evoke a sense of mystery was the key here, they understand the 12 apostles in the centre but they are hopefully intrigued by the funky design aspects to learn more and understand the postcard.
02

Apostles
Rain & Wind

Sea Level

Climate


03
The drive down
During the drive, the tourist is reminded of the card to open the website again.
The website contains a podcast talking about general information about 12 apostles. Also, 4 environmental aspects at 12 apostles data were converted into music to listen along the journey. This two-pronged approach one for the active listener and one for the more passive time-passer type I think covers the audience well. While the curious can ingest both audio pieces.
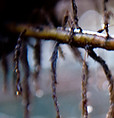
This sculpture is the data of rain. The rain data was recorded from 2015-2019, each layer represents a year from the bottom. The color of the beads represents the 12 months in a year, start from January (the reddest) to December ( purple). The match stick attaches to the beads represent the amount of rain each month (in mm).
This sculpture was created to be strange, curious, and just a little insightful. Once you understand what the pieces mean the art is more beautiful for it.
Therefore I am hiding the inner beauty of this piece behind its rather spiny appearance, to intrigue the audience with this Hidden Data and drive them to know more about it.

04
Destination
Now informed, the whole trip is much more rounded
The sea level data has been converted into music then transformed into a soundwave shape.
The teal represents seawater. I think the color and pattern build together to evoke a sense of the tidal system in the ocean, the never-ending cycle of ebbing and flowing.


"The apostles" are an exploration using a graph in excel then converting into music. The music then is converted into a soundwave generator to produce out the image.
Using resin to create a water-like texture. The navy blue exploration represents the appearance of the 12 apostles above the sea level, while the aqua blue exploration represents the drowned apostles below the sea level.


Case Study

Antartic Explorer by Nathalie Miebach
Nathalie Miebach is a Boston based artist who used weather data as a source of the material. Her work includes a lot of weather data converted into a music and complex sculpture.
Put bluntly, Nathalie captured my imagination when she stated that "The power of data lies in its poetic quality; it is so much more than a number. I use sculpture to visualize the nuances of weather, in a way that a traditional scientific graph cannot.' This sense of data-driven wonderment carries such a curious nature until you know the data set it was derived from, then it gains deeper meaning and Beauty.
Miebach, Nathalie. 2007. "Antarctic Explorer – Darkness to Lightness." Nathalie Miebach, accessed June 08, 2020. http://nathaliemiebach.com/tide.html

Sea Level Rise by Alisa Singer
Alisa Singer is a self-taught artist that lives in Chicago. In 2014, she begin creating a serious digital painting related to climate data. Each painting is derived from a chart, graph, map, word, or number based on a key fact about climate change.
This collection inspires me of translating data into an abstract drawing that contains data information.
Singer, Alisa. 2014. "Environmental Graphiti – the Art of Climate Change."Environmental Graphiti, accessed June 03, 2020. http://www.environmentalgraphiti.org/sea-level-rise
In the future, I could be focusing on the slightly broader scope of tourist sites in Australia and expanding the collection of pieces to wider implementation. This research could be looking at a network of sites and expanding on the data Ideas, or something else entirely.
I had focusing mostly on the environmental/historical setting this semester, I discovered a huge array of hidden pieces of data around the 12 apostles, which made me wonder what sort of information is hidden in other areas and landmarks.
Tourists traveling to some of Australia’s most profound areas of natural beauty often have a long drive ahead of them, supplementing this audience with curious and interesting information is my demographic target.
The scope of this project means that larger government bodies would likely be interested, down to the Shire level, or even local specialists for their input. Though the final product would benefit all sizes of stakeholders.
When discussing Australian natural sites and historical backgrounds a few stakeholders are a little harder to obtain information from, ranging from high government authorities needing a reason to access data down to Aboriginal authorities being difficult to contact online in these COVID times.
I will be using my current research to expand upon what I have learned and grow the scope while retaining a similar approach to the design ethos.
At the end of this research, I would like to create a series of ways to learn about the site with different data approaches, retaining the unique and hidden information ways that I have displayed here. Whether that takes the form of
-
A more formal art exhibition style with larger modular pieces of art
-
A website that expands on the same approach to here but with other Australian landmarks
-
A research paper into the environmental awareness of Victorian mass tourists